Hiring index / October 2026
US Data Center Hiring Snapshot: October 2026
Where 143 monitored employers have live openings, which skills they need and what 2373 employer-stated salary records say about advertised pay.
Published / Data frozen at 10:39 UTC
4,155
live jobs
143
employers hiring
46
states represented
57.1%
with stated pay
The readout
Three signals in the live market
21.4%
of jobs are in Texas
Texas accounts for 891 monitored openings, compared with Virginia's 459.
54.3%
Construction or technician
These two role families make up 2255 of the 4,155 live openings.
43.4%
at the top 10 employers
The ten largest hiring lists contain 1803 live roles in this snapshot.
These are characteristics of Data Center JobHub's monitored employer set, not an estimate of every US data center vacancy. Coverage changes can move the totals, which is why change since August is measured on a fixed panel of employers below, never on these totals.
Since August
What changed since August, like for like
The board held 1,341 live ads at the August cutoff and 4,155 at this one. That difference measures the board, not hiring: 81 employers added to the monitored set after the August cutoff carry 1,659 of this edition's ads, and the rules that decide which ads the board takes changed between the two cutoffs.
150
ads from the 3 panel employers at the August cutoff
161
from the same employers now, counted by August's rules
+7.3%
like-for-like change
3 of the employers named in the August edition had their boards read the same way at both cutoffs: IREN, Fluidstack and xAI. They advertise 205 ads now. 44 of those are titles the August rules turned away, so counted the August way they advertise 161, against 150 then.
That is as wide as this comparison can go. The August edition froze counts only for its 12 largest employers, and the other 9 are out for the reasons below. This edition freezes every employer's count, so the next comparison can take the whole board.
| Employer | August | Now | Like for like |
|---|---|---|---|
| Amazon Data ServicesNot compared. At the August cutoff it was read through four capped keyword searches (300 results each), so that count is what filled the cap, not how many ads it ran. | 175 | 486 | — |
| GoogleNot compared. At the August cutoff it was read through three capped keyword searches (80 results each), so that count is what filled the cap, not how many ads it ran. | 108 | 213 | — |
| QTS Data CentersNot compared. Until 6 September a throttled read of this board could close ads that were still open, and those reads were not logged, so the August count cannot be checked. | 102 | 107 | — |
| IREN9 of its 87 ads are titles the August rules turned away. | 71 | 87 | 78 |
| NTT Global Data CentersNot compared. Until 6 September a throttled read of this board could close ads that were still open, and those reads were not logged, so the August count cannot be checked. | 71 | 53 | — |
| OracleNot compared. Its adapter began reading a keyword search on 6 September, which changes which ads are read. On 21 October its own board moved to that search and the page limit doubled, from 600 ads to 1,200. | 57 | 207 | — |
| MicrosoftNot compared. At the August cutoff it was read through three capped keyword searches (40 results each), so that count is what filled the cap, not how many ads it ran. | 51 | 66 | — |
| CyrusOneNot compared. Until 6 September a throttled read of this board could close ads that were still open, and those reads were not logged, so the August count cannot be checked. On 21 October its adapter began reading ads filed under a site code instead of a place, which is how it files some of its own. | 49 | 64 | — |
| IES HoldingsNot compared. Until 26 September a failed page could cut a read of this board short and close the ads after it, and those failures were not logged, so the August count cannot be checked. | 47 | 52 | — |
| Fluidstack22 of its 51 ads are titles the August rules turned away. | 43 | 51 | 29 |
| SwitchNot compared. Its ads are read from greenhouse now and were read from clearcompany at the August cutoff, so the two counts come from different boards. | 37 | 54 | — |
| xAI13 of its 67 ads are titles the August rules turned away. | 36 | 67 | 54 |
| Panel, 3 employers | 150 | 205 | 161 |
“Like for like” drops the ads only the newer title rules admit. Ads the newer rules turn away never reach the board, so they cannot be counted back in: the like-for-like figure is a floor, and the change it gives is, if anything, understated. Counts are live listings, not headcount.
Download the like-for-like panel (CSV)Geography
Texas and Virginia hold 32.4% of openings
The concentration is visible at state level: 1350 of the 4,155 jobs are in Texas or Virginia. Across the dataset, jobs appear in 579 distinct city-and-state combinations.
Role demand
Building and operating capacity drives the list
Construction is the largest role family at 1511 jobs, followed by data center technician roles at 744. Critical facilities engineer adds another 435 openings.
Employers
The largest live hiring lists
Amazon Data Services leads the monitored set with 486 openings. The ranking measures live listings, not headcount or company growth.
| Employer | Live jobs | Share |
|---|---|---|
| Amazon Data Services | 486 | 11.7% |
| Turner & Townsend | 248 | 6.0% |
| 213 | 5.1% | |
| Oracle | 207 | 5.0% |
| M.C. Dean | 172 | 4.1% |
| STO Building Group | 125 | 3.0% |
| QTS Data Centers | 107 | 2.6% |
| IREN | 87 | 2.1% |
| JLL Data Centre Solutions | 85 | 2.0% |
| GXO Logistics | 73 | 1.8% |
Advertised pay
What employer-stated ranges show
Employers state a salary range on 2373 listings, or 57.1% of the snapshot. Annual and hourly listings are reported separately. Each figure below is the median advertised lower or upper bound within a broad role group, not median worker earnings.
Annual salary listings
| Role group | Listings | Median low | Median high |
|---|---|---|---|
| Construction | 677 | $117,800/yr | $180,000/yr |
| Design and engineering | 280 | $120,000/yr | $184,800/yr |
| Data center operations | 194 | $122,000/yr | $187,000/yr |
| Data center technician | 134 | $85,060/yr | $118,000/yr |
| Critical facilities engineer | 102 | $104,850/yr | $166,300/yr |
| Commissioning | 74 | $120,000/yr | $170,000/yr |
| Logistics | 66 | $113,655/yr | $195,000/yr |
| NOC technician | 32 | $139,000/yr | $204,000/yr |
| Security | 31 | $116,000/yr | $167,000/yr |
| HVAC technician | 24 | $84,000/yr | $122,500/yr |
| Sales | 17 | $127,000/yr | $168,000/yr |
| Electrician | 8 | $103,120/yr | $129,150/yr |
Hourly wage listings
| Role group | Listings | Median low | Median high |
|---|---|---|---|
| Data center technician | 366 | $32.52/hr | $55.00/hr |
| Critical facilities engineer | 111 | $35.00/hr | $45.00/hr |
| Construction | 49 | $35.00/hr | $42.00/hr |
| HVAC technician | 40 | $38.50/hr | $50.00/hr |
| Security | 29 | $20.19/hr | $28.85/hr |
| Logistics | 27 | $24.27/hr | $42.54/hr |
| Electrician | 8 | $35.50/hr | $51.75/hr |
| Commissioning | 8 | $41.78/hr | $57.23/hr |
Pay transparency
Ads state pay far more often where the law requires it
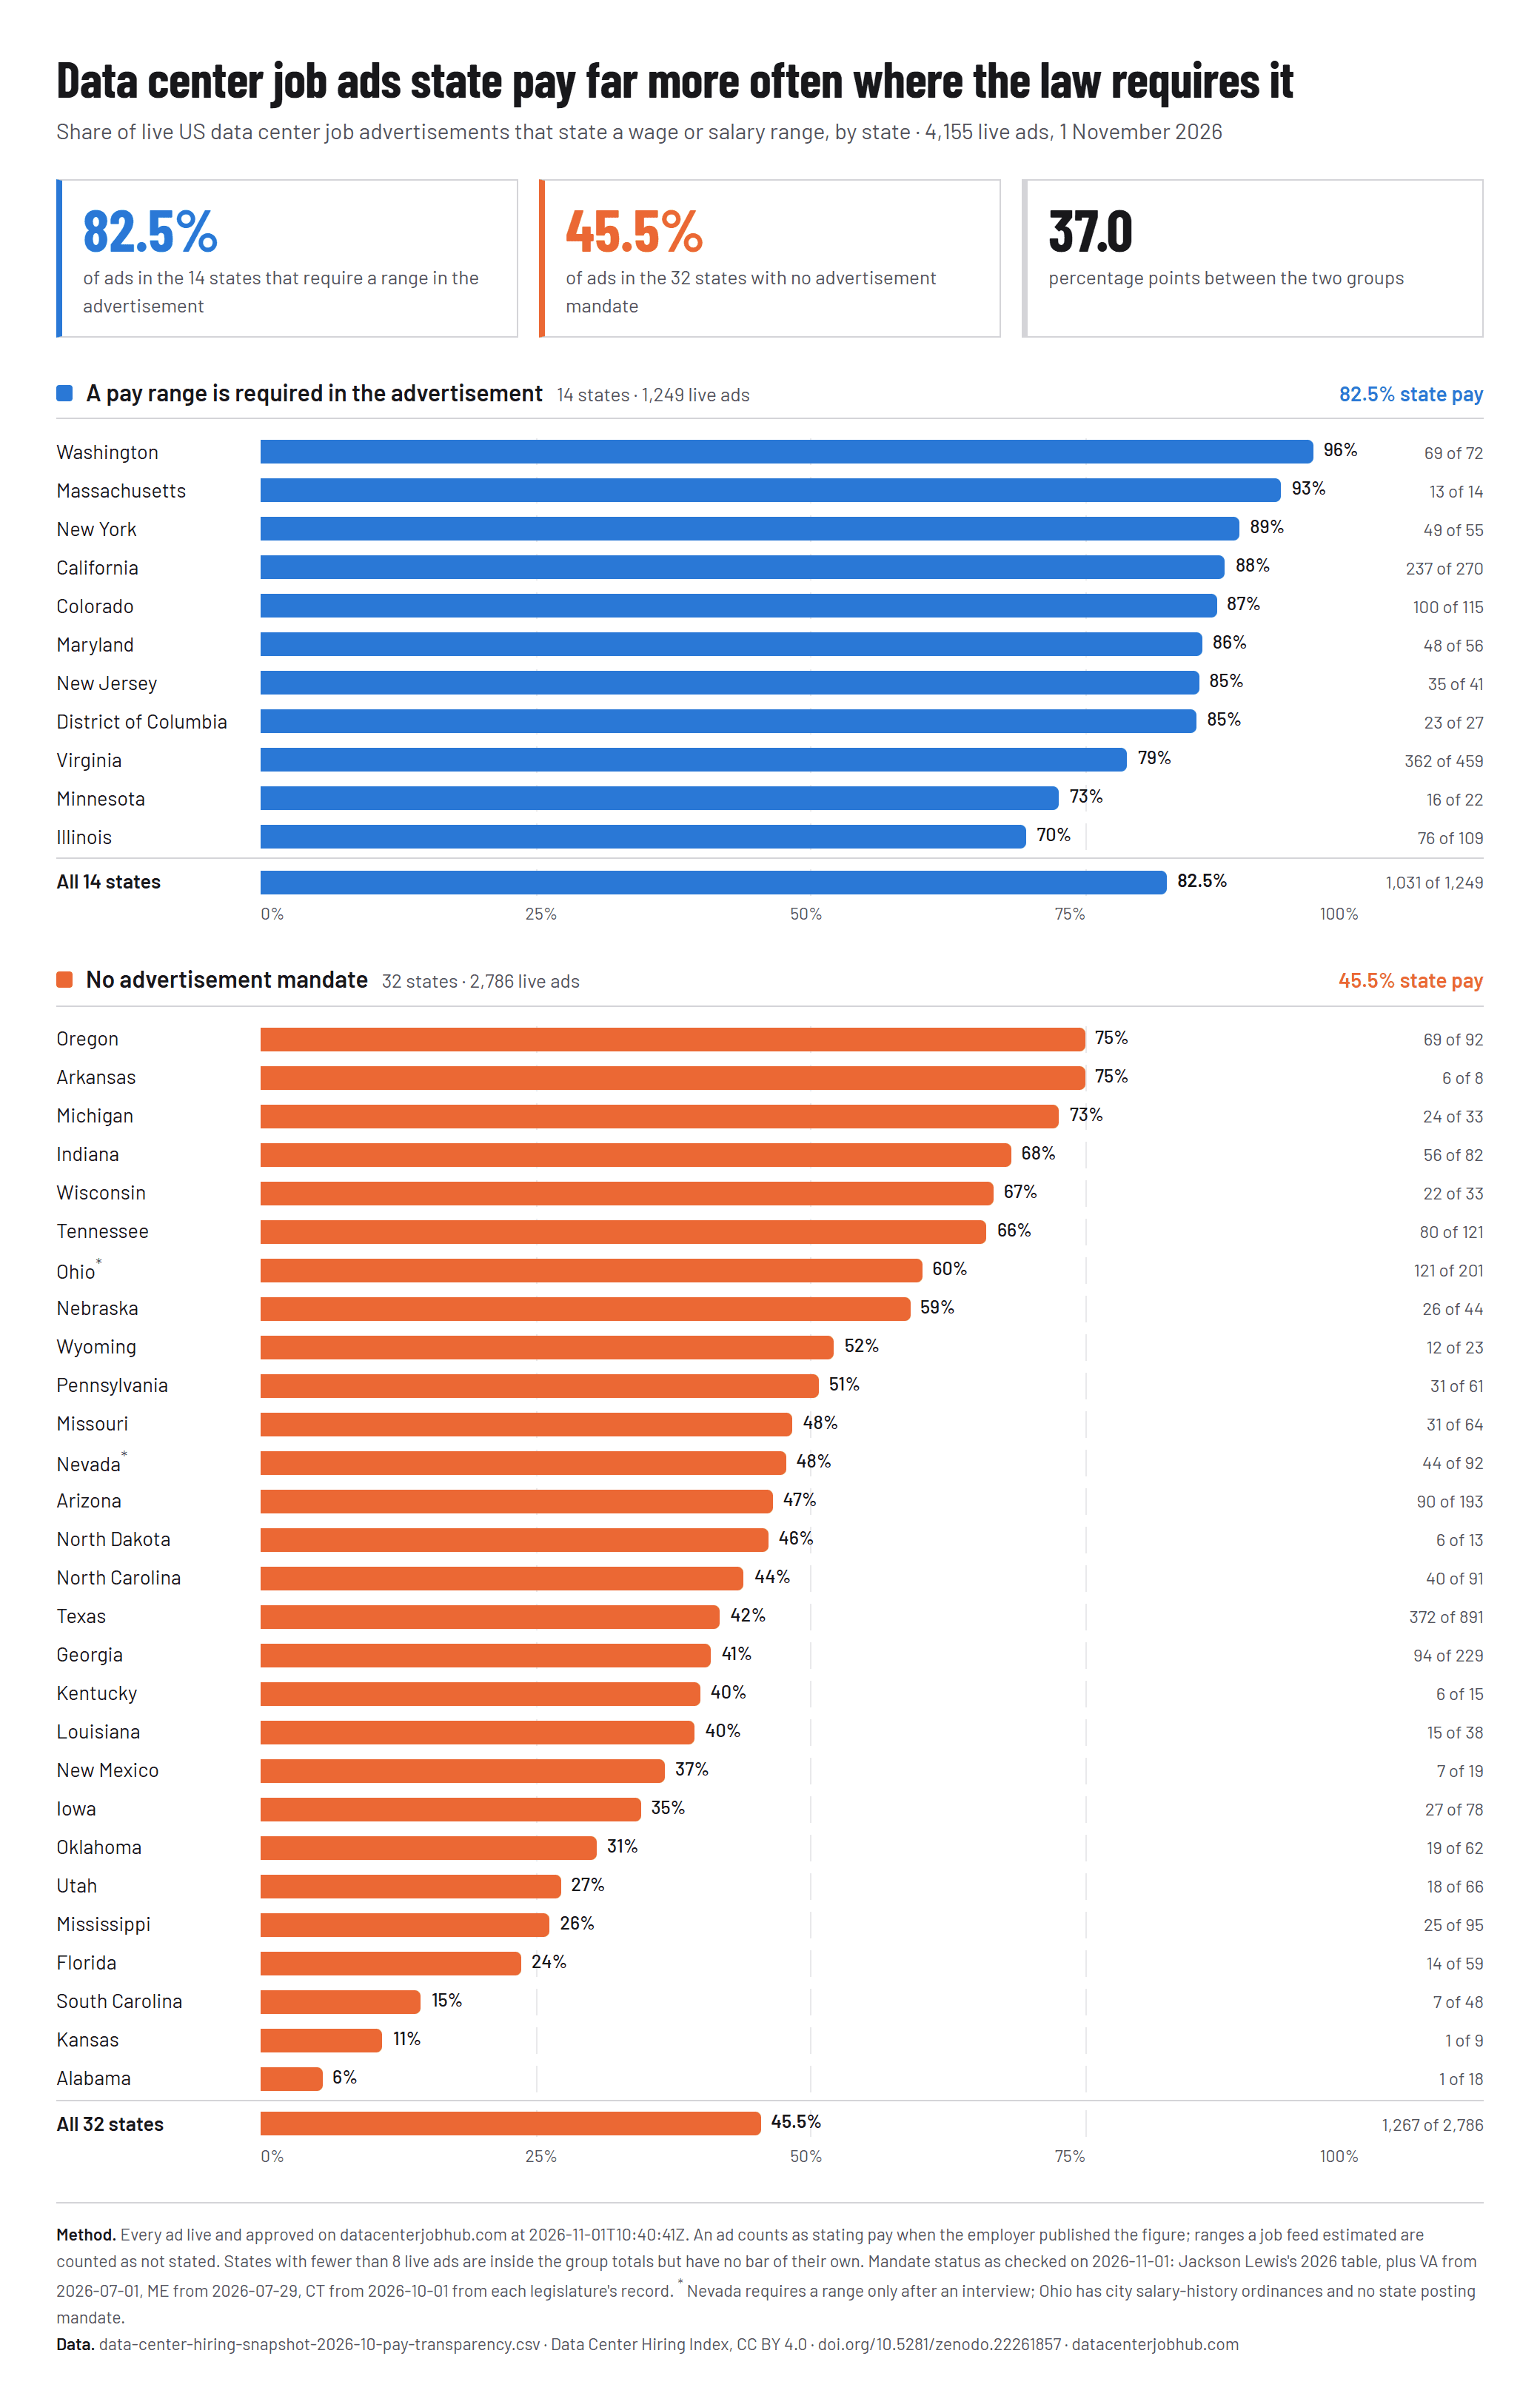
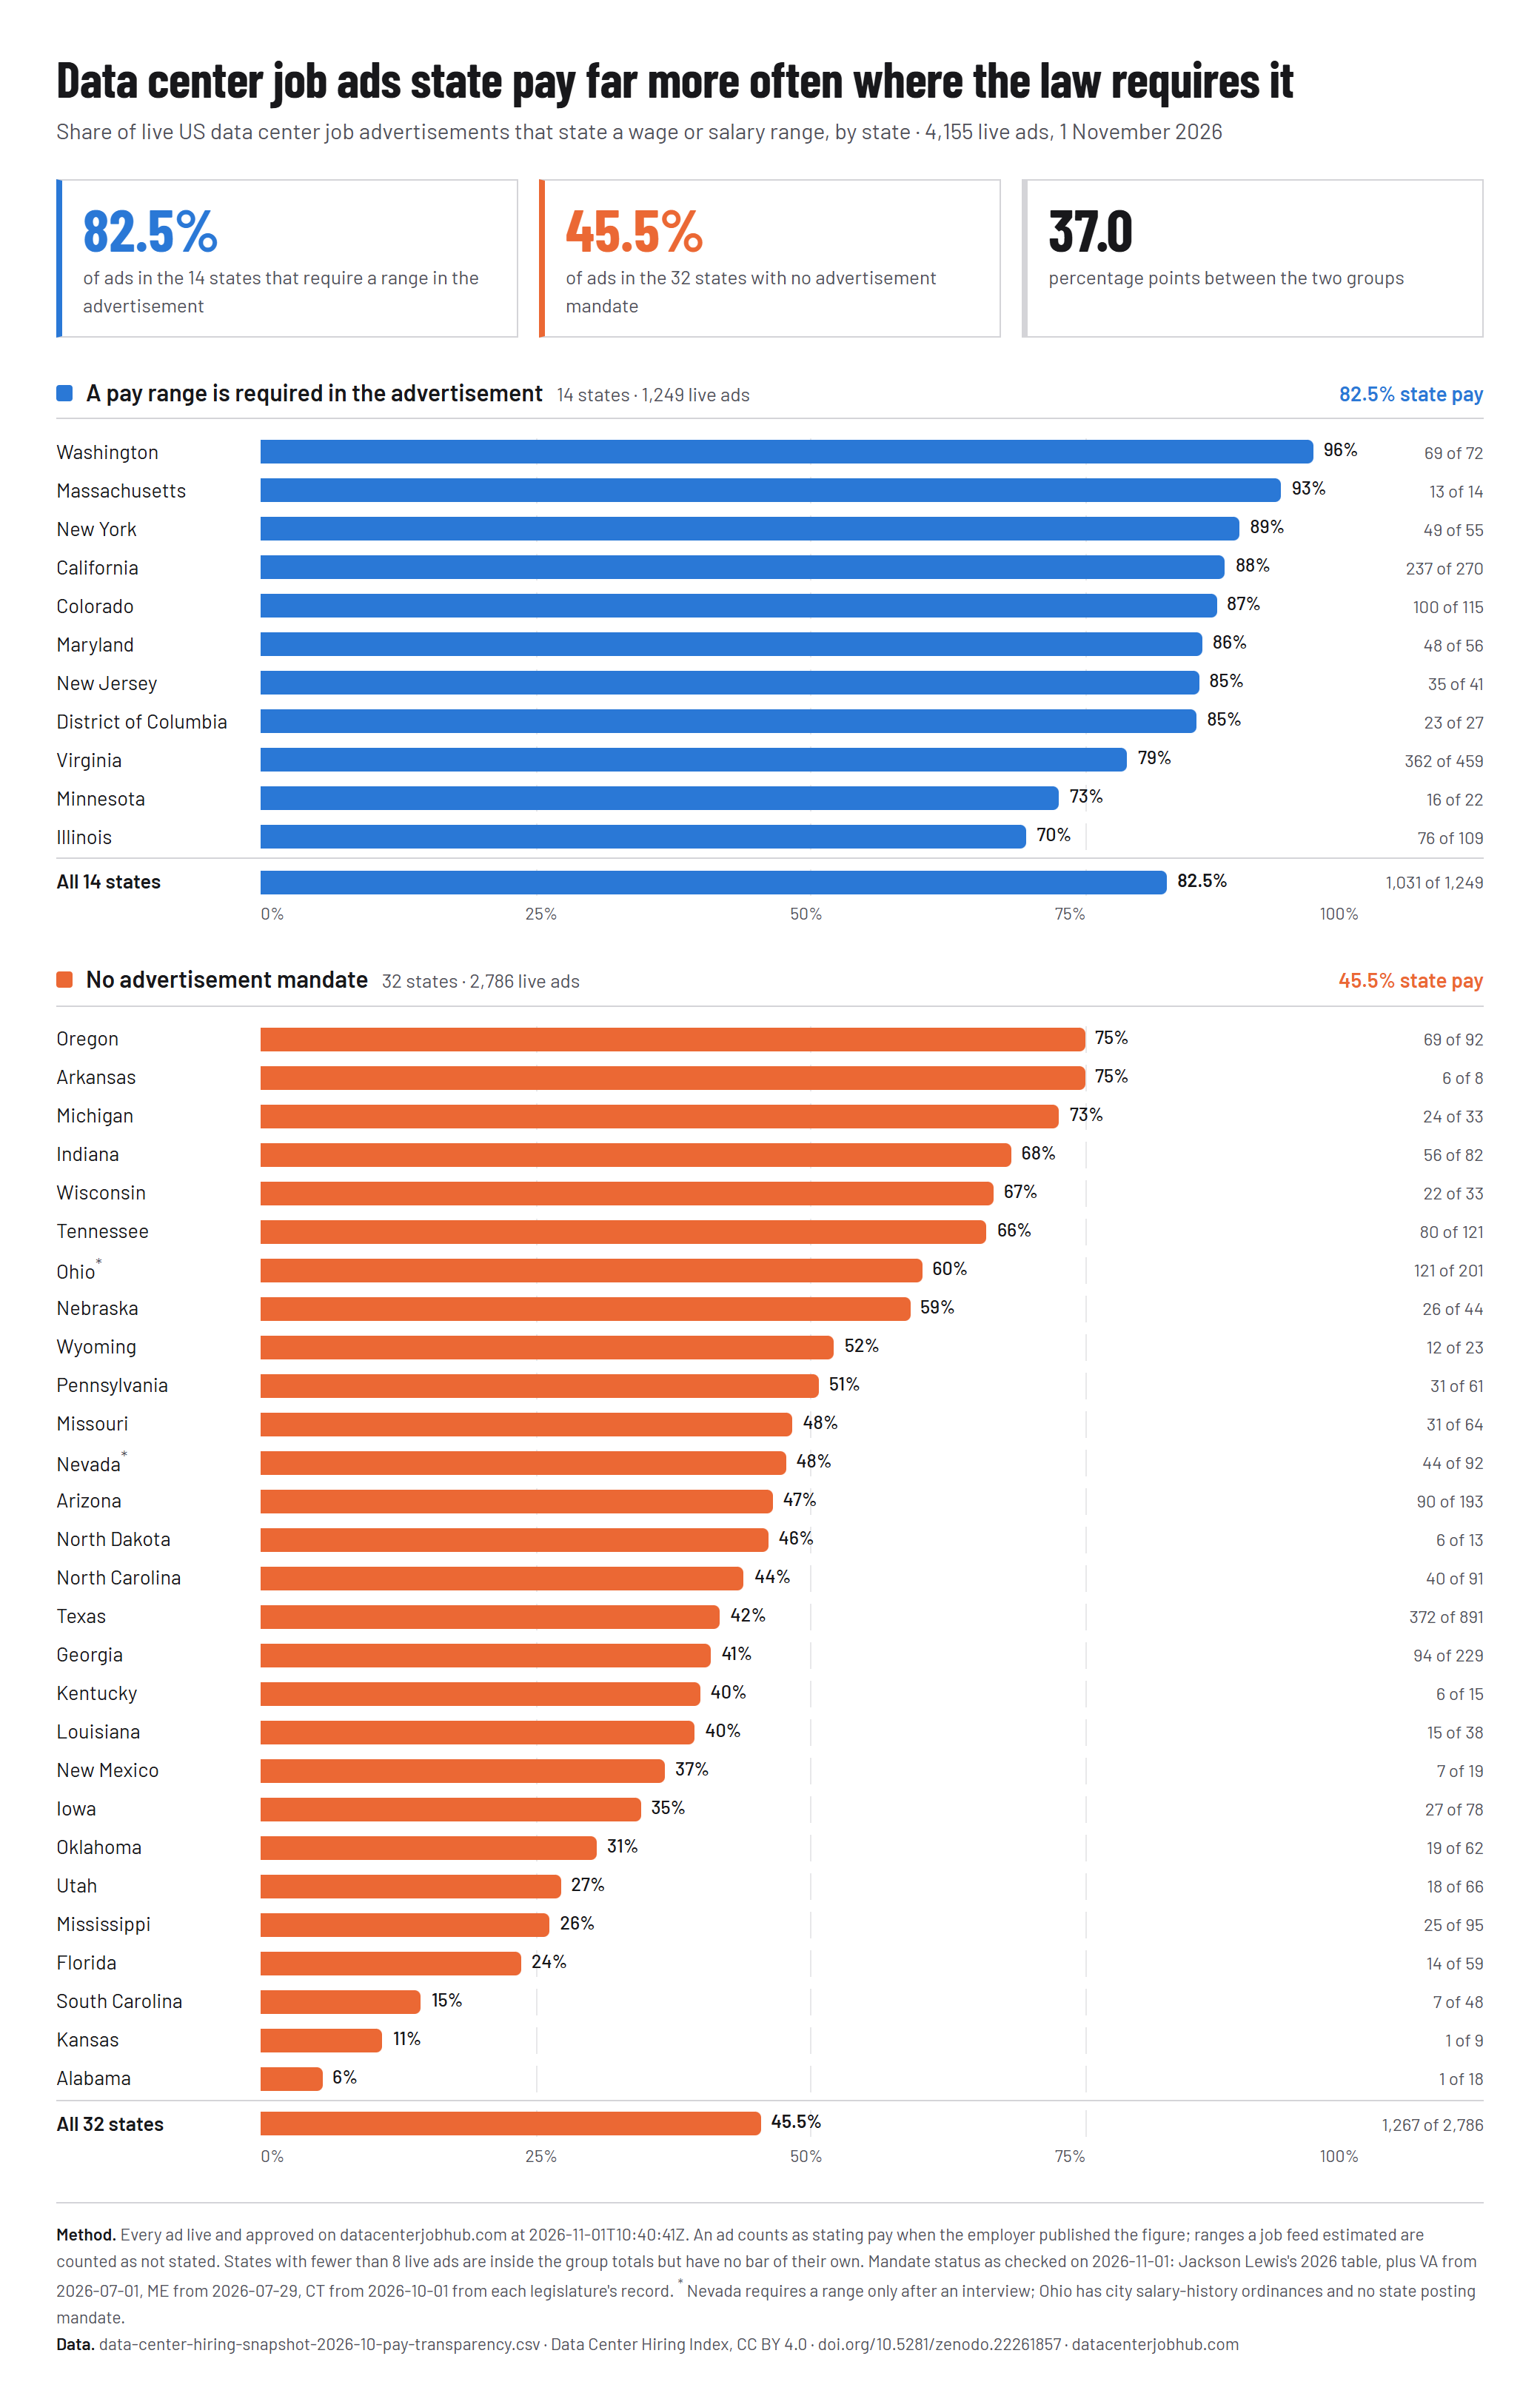
In the 14 states that require a pay range in the advertisement itself and had live data center ads, 1,031 of 1,249 ads state pay. In the 32 states with no such mandate, 1,267 of 2,786.
82.5%
of ads state pay in the 14 states that require a range in the advertisement
45.5%
of ads state pay in the 32 states with no advertisement mandate
37.0
percentage points between the two groups
| Group | Live ads | State pay | Share |
|---|---|---|---|
| States requiring a pay range in the advertisement14 states | 1,249 | 1,031 | 82.5% |
| States with no advertisement mandate32 states | 2,786 | 1,267 | 45.5% |
| All live ads46 states | 4,155 | 2,373 | 57.1% |
The largest markets are mostly on the no-mandate side. Of the 8 states with the most live ads in this snapshot, only Virginia, California and Colorado require a range in the advertisement; Texas, Georgia, Ohio, Arizona and Tennessee do not.
The same employers, compared with themselves. 44 employers advertise at least 5 jobs on each side of the line. They state pay in 84.5% of their mandate-state ads (872 of 1,032) and 56.1% of their ads elsewhere (1,041 of 1,856). The per-employer rows are in the CSV below; they are not named here.
By state
| State | Live ads | State pay | Share |
|---|---|---|---|
| A pay range is required in the advertisement | |||
| Virginia | 459 | 362 | 78.9% |
| California | 270 | 237 | 87.8% |
| Colorado | 115 | 100 | 87.0% |
| Illinois | 109 | 76 | 69.7% |
| Washington | 72 | 69 | 95.8% |
| Maryland | 56 | 48 | 85.7% |
| New York | 55 | 49 | 89.1% |
| New Jersey | 41 | 35 | 85.4% |
| District of Columbia | 27 | 23 | 85.2% |
| Minnesota | 22 | 16 | 72.7% |
| Massachusetts | 14 | 13 | 92.9% |
| States requiring a pay range in the advertisement14 states | 1,249 | 1,031 | 82.5% |
| No advertisement mandate | |||
| Texas | 891 | 372 | 41.8% |
| Georgia | 229 | 94 | 41.0% |
| Ohio1 | 201 | 121 | 60.2% |
| Arizona | 193 | 90 | 46.6% |
| Tennessee | 121 | 80 | 66.1% |
| Mississippi | 95 | 25 | 26.3% |
| Nevada2 | 92 | 44 | 47.8% |
| Oregon | 92 | 69 | 75.0% |
| North Carolina | 91 | 40 | 44.0% |
| Indiana | 82 | 56 | 68.3% |
| Iowa | 78 | 27 | 34.6% |
| Utah | 66 | 18 | 27.3% |
| Missouri | 64 | 31 | 48.4% |
| Oklahoma | 62 | 19 | 30.6% |
| Pennsylvania | 61 | 31 | 50.8% |
| Florida | 59 | 14 | 23.7% |
| South Carolina | 48 | 7 | 14.6% |
| Nebraska | 44 | 26 | 59.1% |
| Louisiana | 38 | 15 | 39.5% |
| Michigan | 33 | 24 | 72.7% |
| Wisconsin | 33 | 22 | 66.7% |
| Wyoming | 23 | 12 | 52.2% |
| New Mexico | 19 | 7 | 36.8% |
| Alabama | 18 | 1 | 5.6% |
| Kentucky | 15 | 6 | 40.0% |
| North Dakota | 13 | 6 | 46.2% |
| Kansas | 9 | 1 | 11.1% |
| Arkansas | 8 | 6 | 75.0% |
| States with no advertisement mandate32 states | 2,786 | 1,267 | 45.5% |
- 1 Ohio: city salary-history ordinances, no state posting mandate.
- 2 Nevada: range required only after an interview, not in the advertisement.
How this cut was made
- Its own cutoff: every ad live and approved on Data Center JobHub at 10:40 UTC on November 1, 2026, 4,155 ads. The edition above froze earlier, at 4,155 ads, and its figures are never revised; this crosstab records its own instant instead, and every row of the CSV carries it. The overall stated-pay share is 57.1% either way.
- Stated pay: the employer published a wage or salary figure in the ad. Ranges a job feed estimated count as not stated.
- Mandate status: 15 US jurisdictions (CA, CO, DC, HI, IL, MD, MA, MN, NJ, NY, VT, WA, VA, ME, CT) require a pay range in the advertisement at this cutoff, as checked on November 1, 2026: the 12 in Jackson Lewis's 2026 table, and Virginia (in force July 1, 2026), Maine (in force July 29, 2026) and Connecticut (in force October 1, 2026), from each legislature's own record; 14 of them had live data center ads. Laws that require a range only on request or after an interview count as no advertisement mandate.
- Floor: 7 states with fewer than 8 live ads are inside the group totals but are not ranked on their own. The CSV lists all 46.
Methodology
How this snapshot was built
- Cutoff: live US listings in the Data Center JobHub database at 10:39 UTC on November 1, 2026.
- Scope: 4,155 jobs from 143 monitored employers. Closed, expired and duplicate listings are excluded.
- Roles: job titles are grouped into broad data center role families. A family can include several seniority levels and specialties.
- Pay: only employer-stated USD amounts are included. Estimated salaries are excluded, and samples with different pay periods are not combined.
- Limits: this is a census of the monitored listings, not the entire US labor market. Change since August is reported only for the 3 employers whose boards were read the same way at both cutoffs, counted by August's title rules.
Reuse and citation
These aggregates are published under CC BY 4.0. You may republish and adapt them, including commercially, with credit to Data Center JobHub and a link to this report. The licence covers the aggregate tables only — not the underlying job listings, which belong to the employers who published them.
Cite this edition: Data Center JobHub (2026). US Data Center Hiring Snapshot: October 2026. Zenodo. https://doi.org/10.5281/zenodo.24042965